Sections in this page:
- Pre-Match Conference (Introduction)
- Breaking down the "Flank attacks"
- Match-Wise Analysis
- Team Analysis
- Player Analysis
- Interactive R Shiny Application
- Creating the viz using StatsBomb data
- Post-Match Conference (Inference)
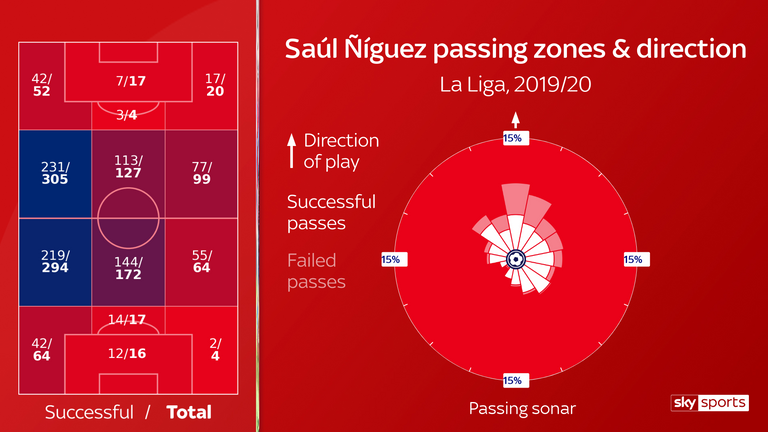
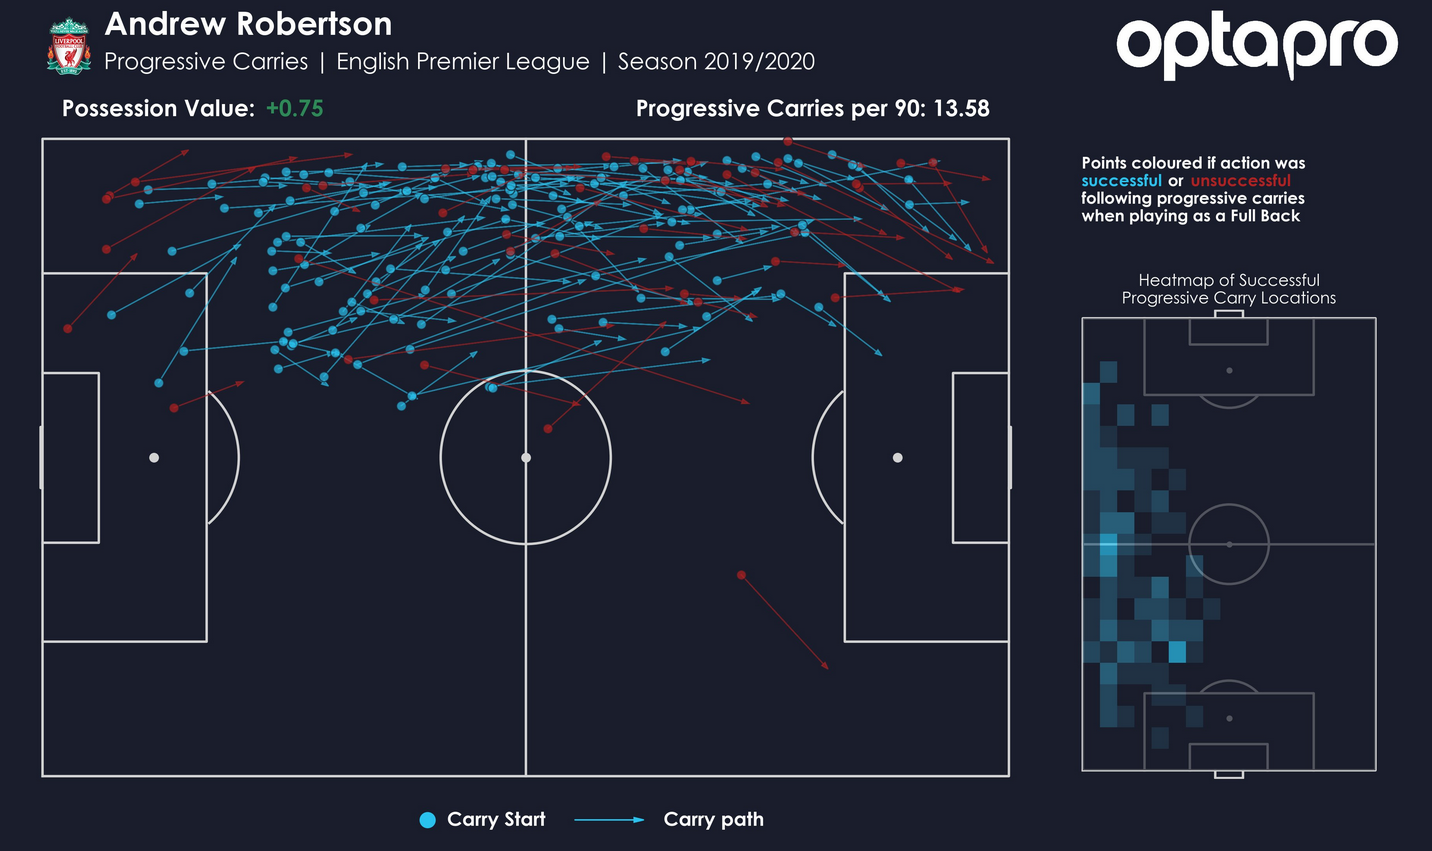
- A lot of analysis has been done to study the quality of the opposing team in its attacking half / attacking final 3rd. The de-facto metrics used are touches, passes, take-ons all per zone stats and are eventually visualized as zonemaps [1] . Sometimes events like carries of a particular player are shown on a event map. [2]
- If we are can figure out where in the attacking third a team was most productive, it will be easier to digest this information during match by match analysis than looking at individual heatmaps or eventsmap.
- In this article we'll be looking to quantify a team's attacking prowess based on their "entries into final third", taking into account passes, carries, take-ons into each zone of the attacking third ( i.e Left Wing, Center, Right Wing.) and their corresponding success percentage.
- This concept was inspired by Mark Thompson & his team's work on the same topic What is a Flank Attacks visualisation? to encourage readers to appreciate this viz and to show how to build such a viz using StatsBomb Open Data.
- Disclaimer : I am not a nerdy analyst but I am happy to test my analytical and explanotory skills here.
- One of the key take-aways from this article is that we can make use of the Flank attacks viz to summarise the team's attacking prowess.
- The other side of the coin - We must not limit ourselves to just using this particular viz. Instead we can use it as a filter to analyse large sets of matches, and then probably video analysts can select the intended matches according to their needs.
- Currently, the "entries" consider only passes, dribbles and take-ons with success % and depth in metres. In future we can fitler each event and add more info like pass angle and passes per sequence etc.
Pre-Match Conference:
Breaking down the "Flank attacks"
Imagine a toll collection area running from touch-line to touch-line 2/3rds of the way down the length of the pitch
with 3 toll booths. Similar to counting vehicles, we can count the number of ball entries at each booth.
This includes passes and carries that begin before the border and end after, but those that start and end
in the final third are not counted. Passes/Carries starting and
ending in the final 3rd are not counted for instance.
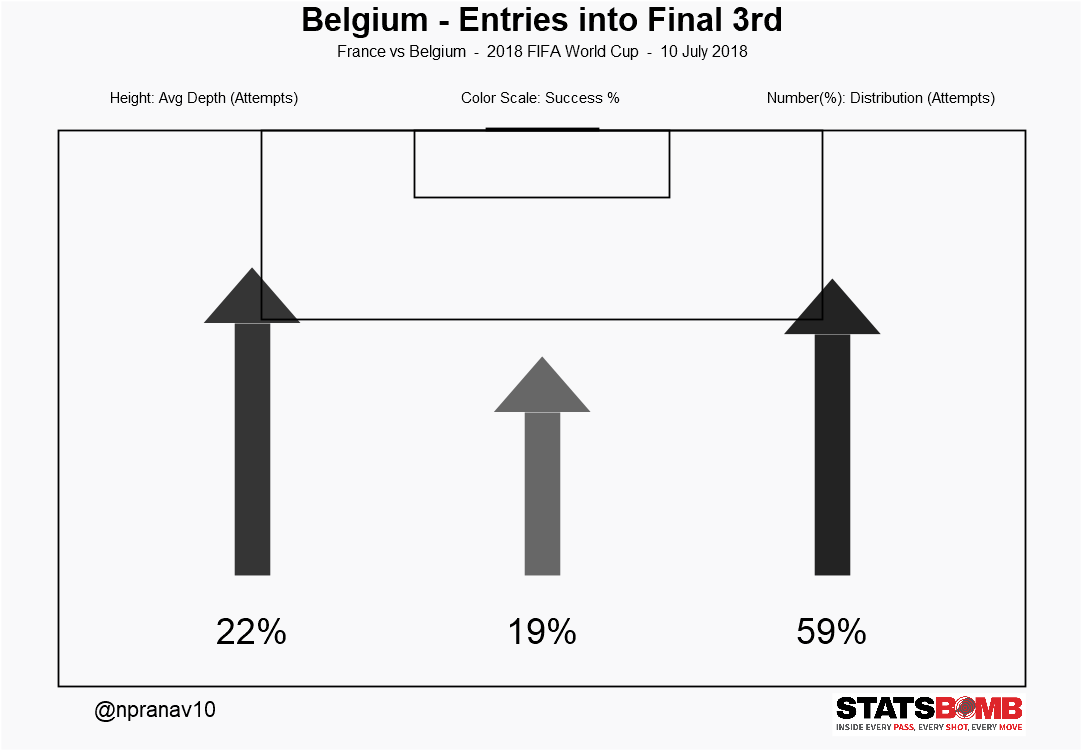
The following plot showcases Belgium's final 3rd entries in the 2018 FIFA World Cup Semi-Final vs France.
Belgium were active 60% of the time at their Right Wing and it was also their most succesful attacking zone in the final 3rd.
| Aspect | Corresponds To |
|---|---|
| Arrow height | Average depth of all attempted entries |
| Arrow color | Scale of the color represents the success % of the attempted entries. Darker is the best. |
| Numbers in % | Success percentage of all attempted entries. |
Match Analysis:
Match Analysis (Match 1/3):
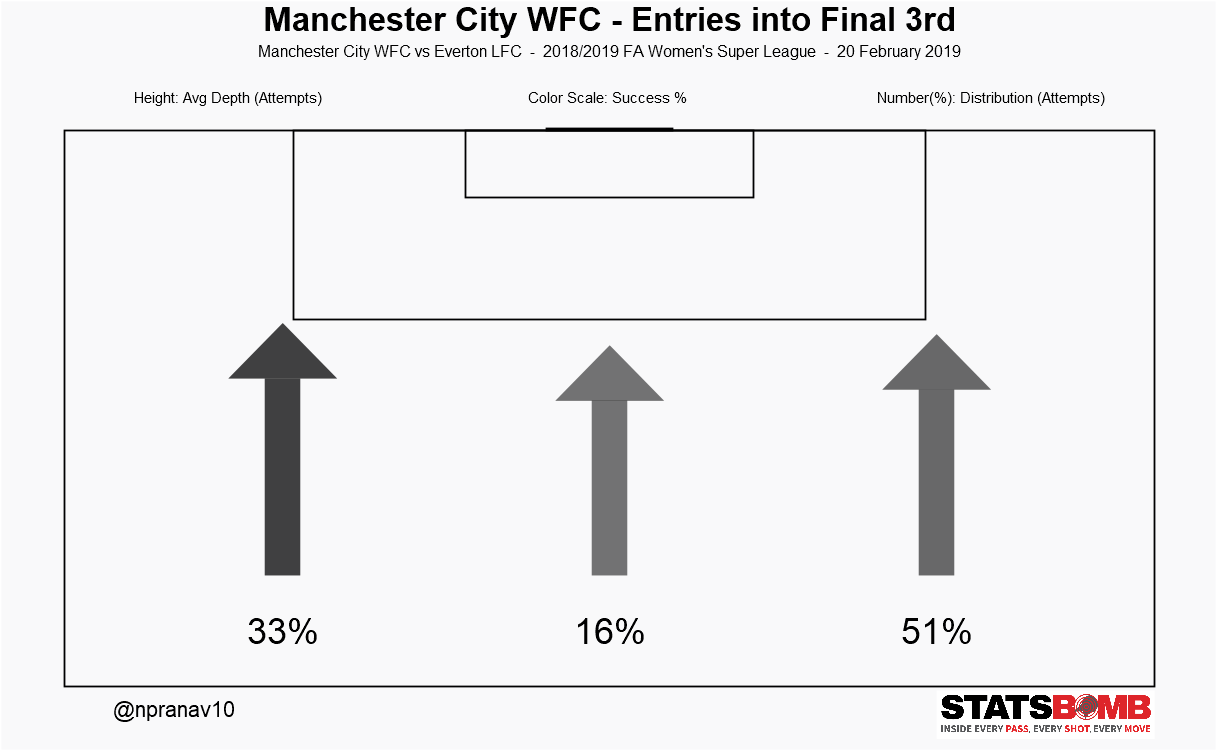
City Women's depth was consistent but failed to make more out of their entries in the Right Flank.
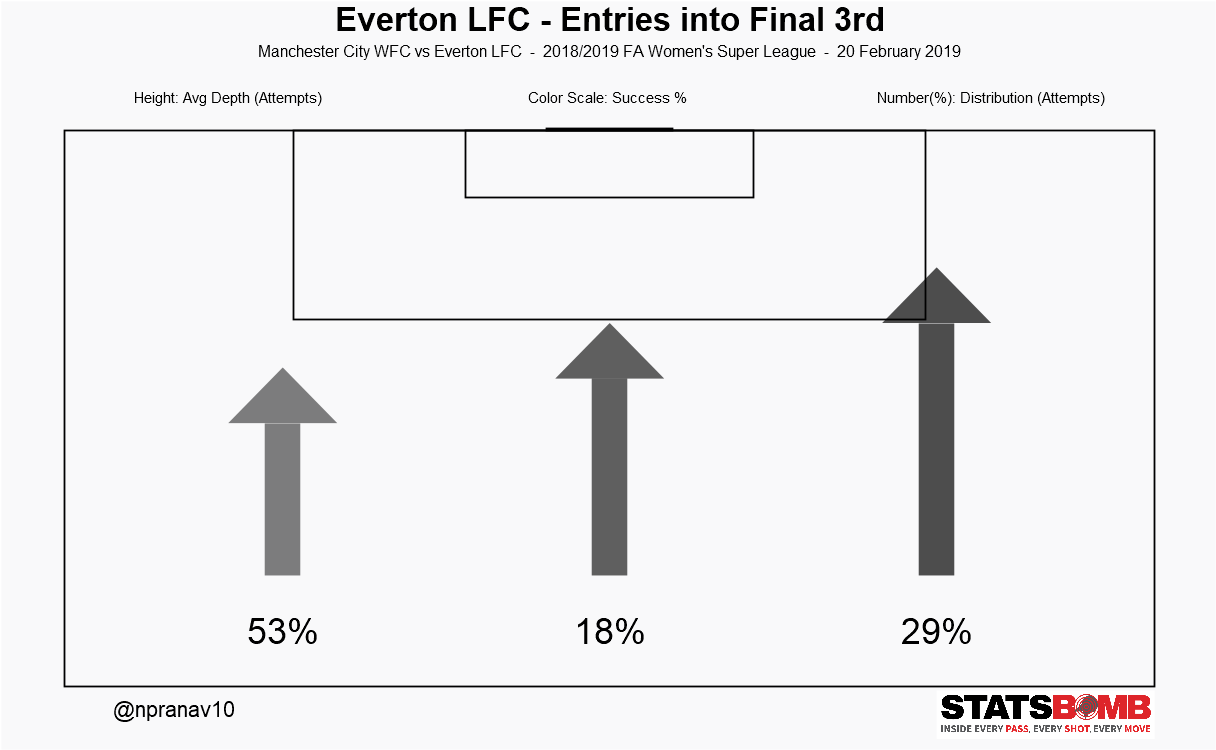
Everton Ladies' attempted more entries on the left but it had the least depth and success % among all 3 zones.
Match Analysis (Match 2/3):
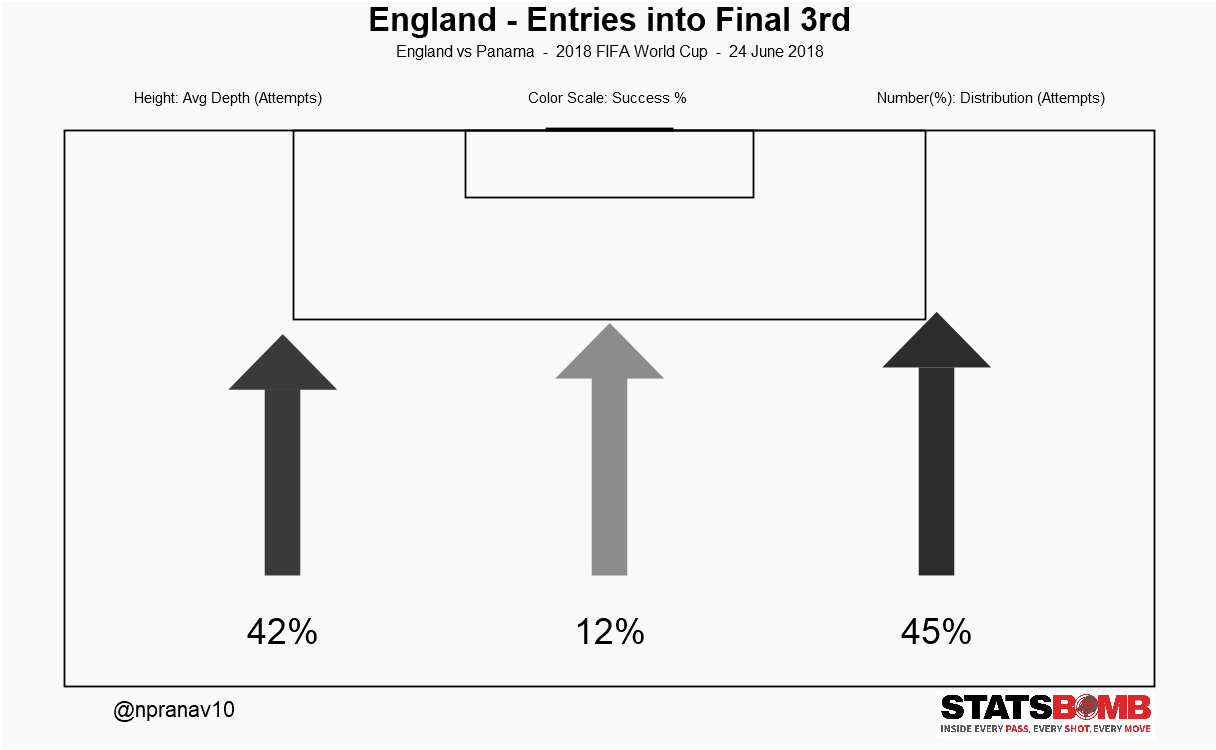
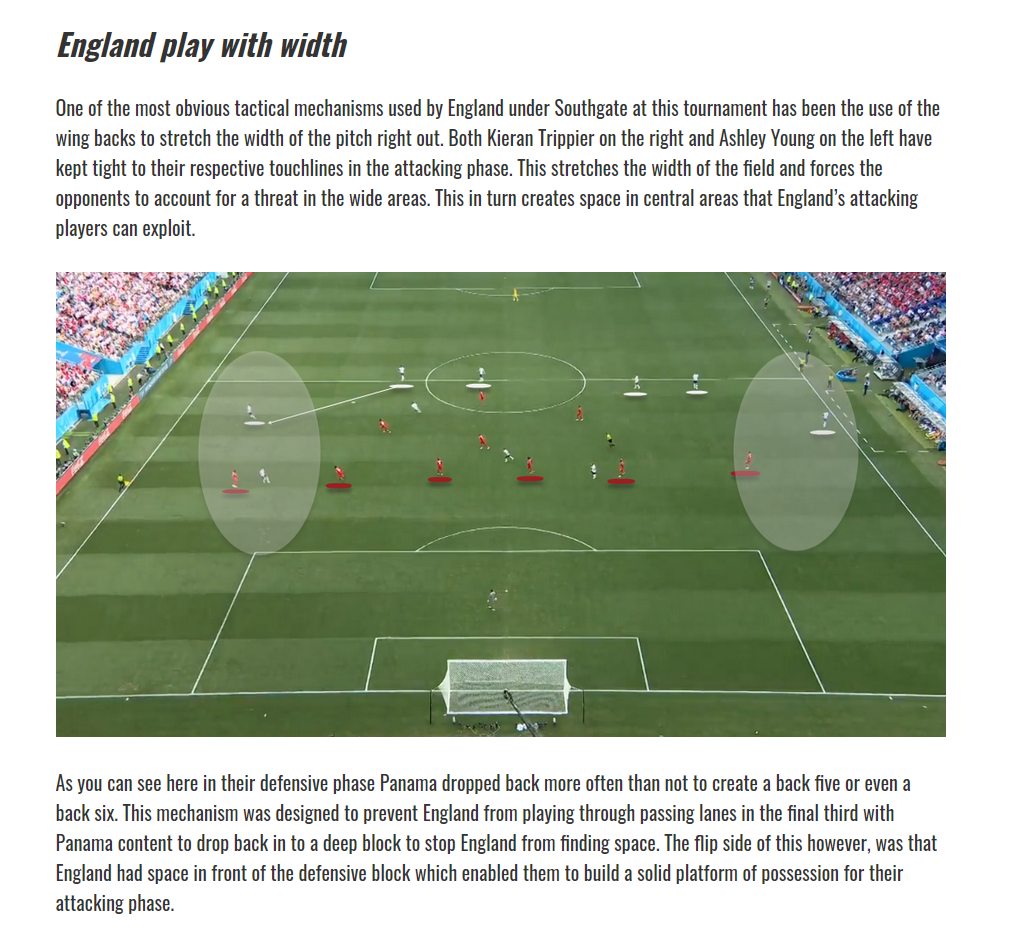
England made use of their flanks 80% of the time, when they entered into final 3rd. This picture illustrated below (report from TotalFootballAnalysis) clealy supports the data.
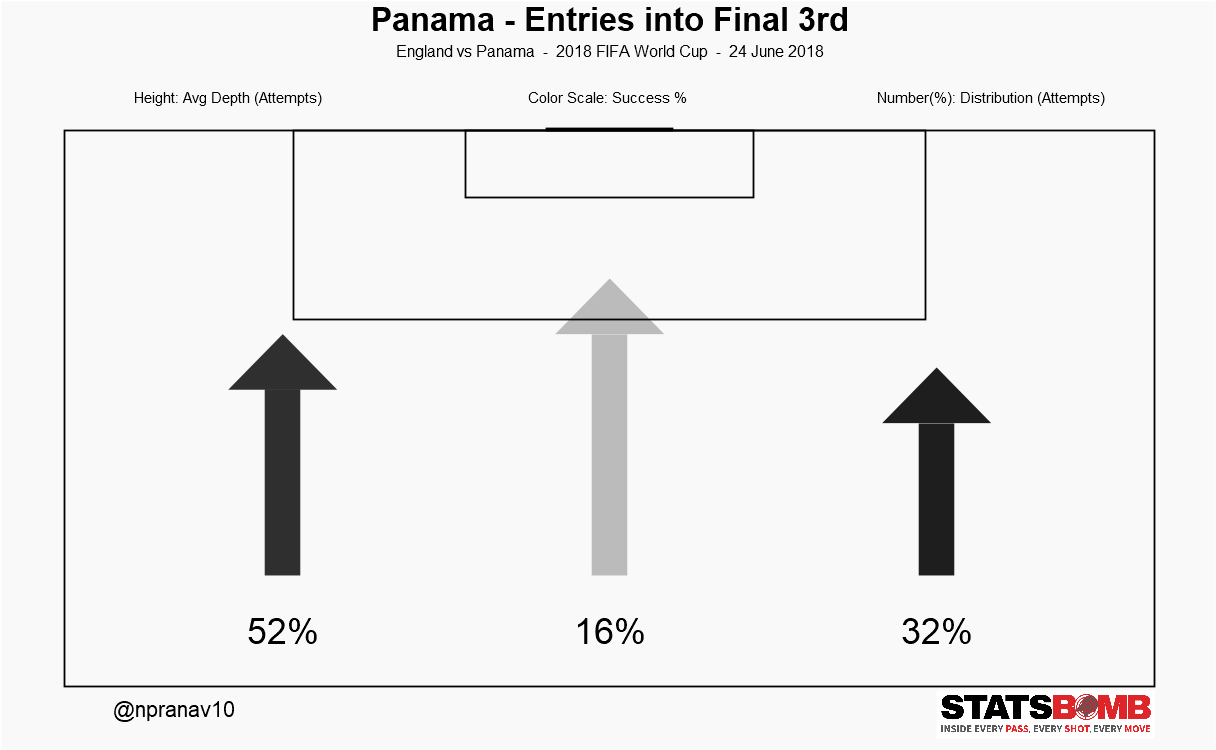
Panama's picture tells exactly you what it is to play against a 3-5-2 setup. England's packed midfield did a good job in keeping Panama at bay.
Match Analysis (Match 3/3):
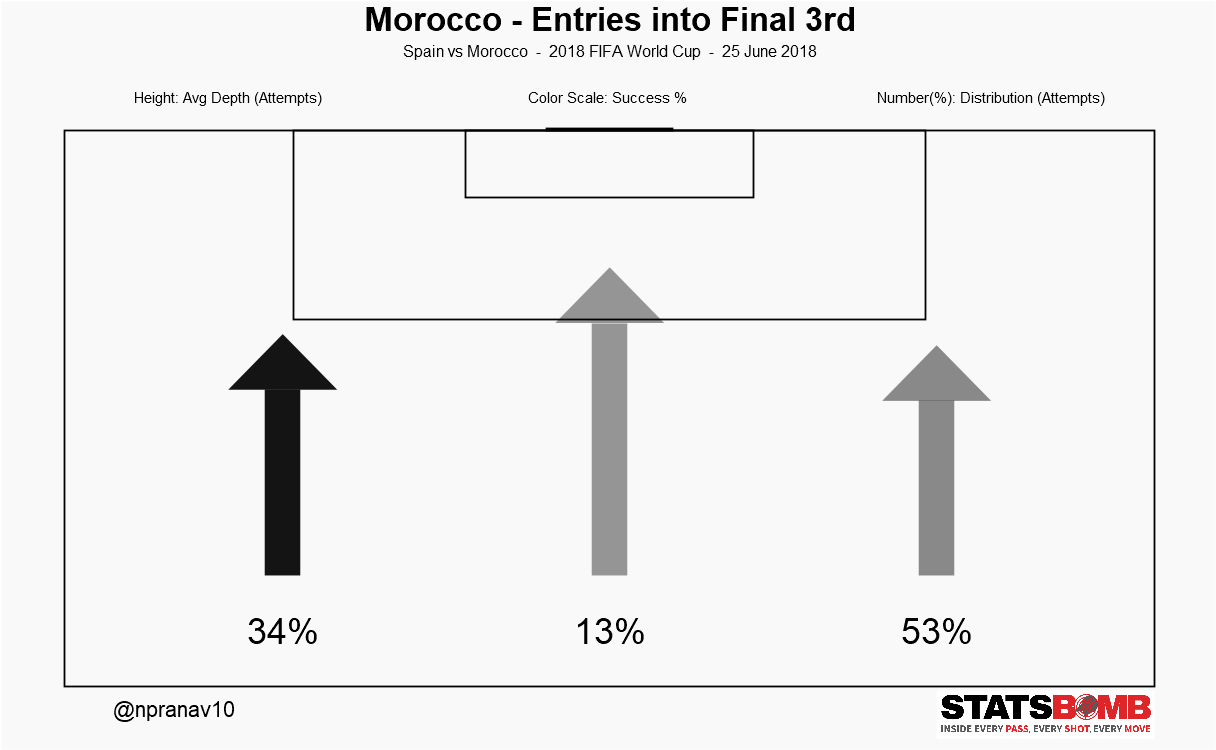
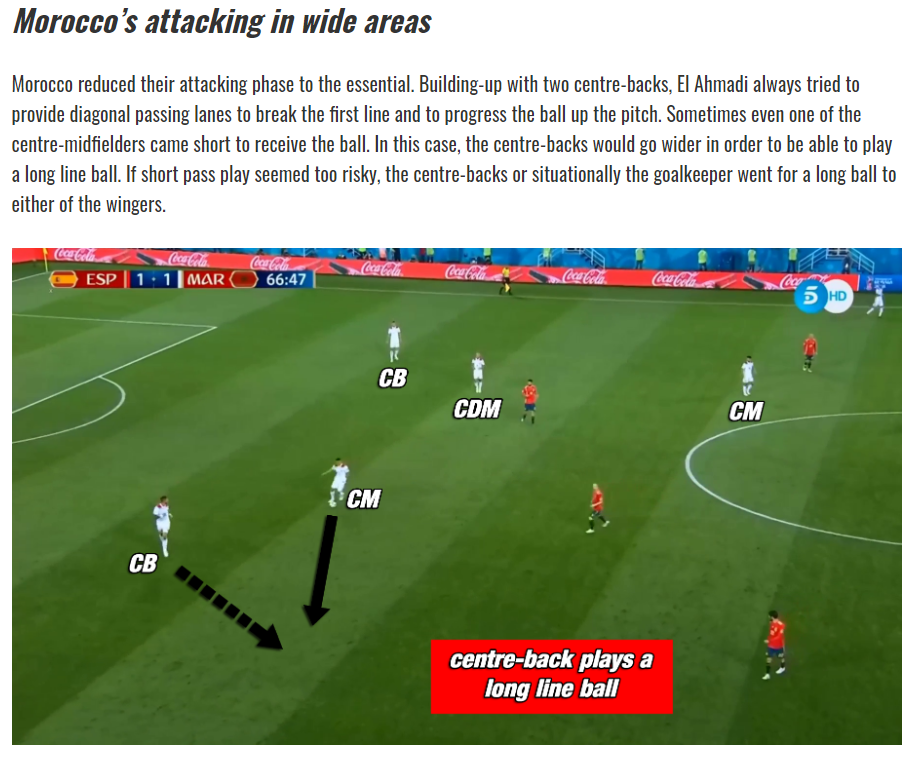
Morocco defenders preferring to initiate sequences on the flanks.
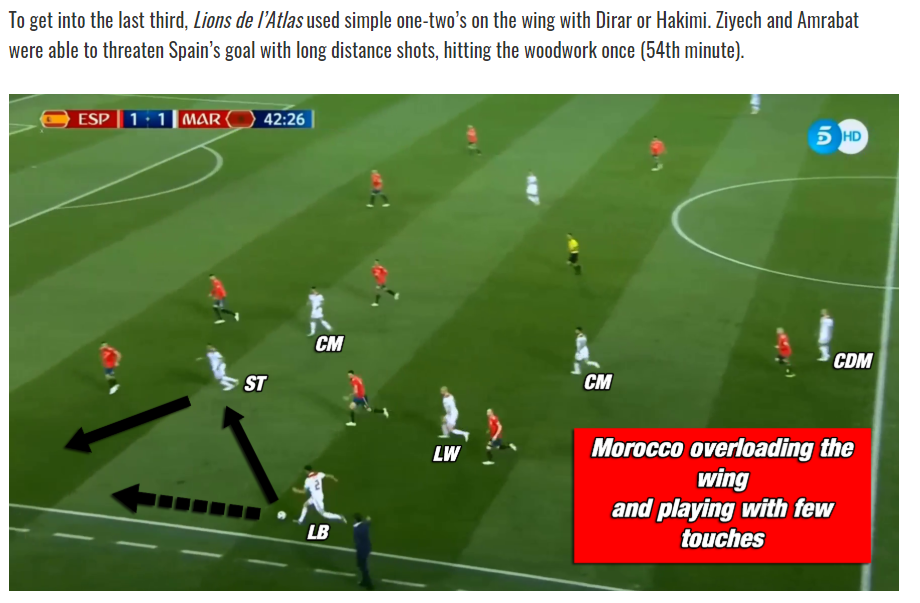
"Hakim Ziyech and Achraf Hakimi had the best combo play. Their linkups helped Morocco achieve more success on the LW. Though the RW group received the ball more often than LW yet they produced a output of lesser quality.
Team Analysis:

Player Analysis:
Player Analysis (1/2):
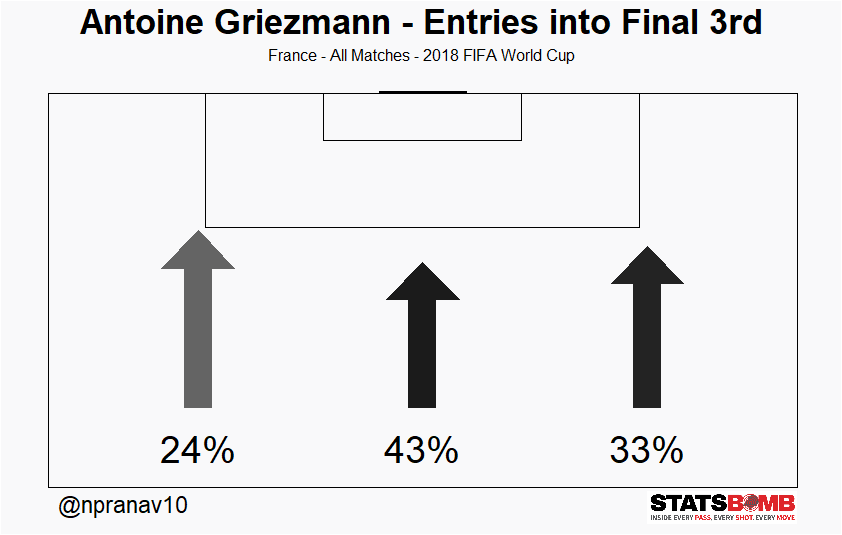
Let's take a look at the tournament perfomance of the World Cup Final's MOTM Antione Griezmann. On the whole he played
as a CAM for most of the matches, but shifted to Right Striker when France played 4-4-2 while defending. Hence the
account for high stats on the right.
Player Analysis (2/2):
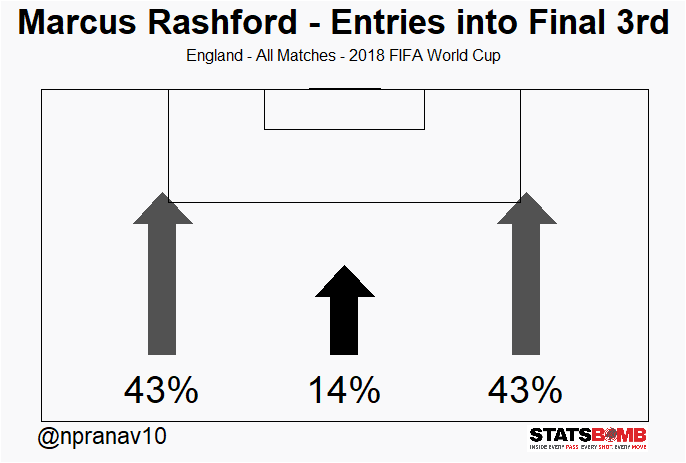
Prior to the World Cup, Rashford was nominated as a winger because Kane and Sterling were both fixtures in the 2 man attack,
due to their end-of-the-season Premier League form. Most often Rashford was substituted in for Raheem Sterling as the Right striker.
But interestingly he contributed equal amount on both the wings.
R Shiny Application:


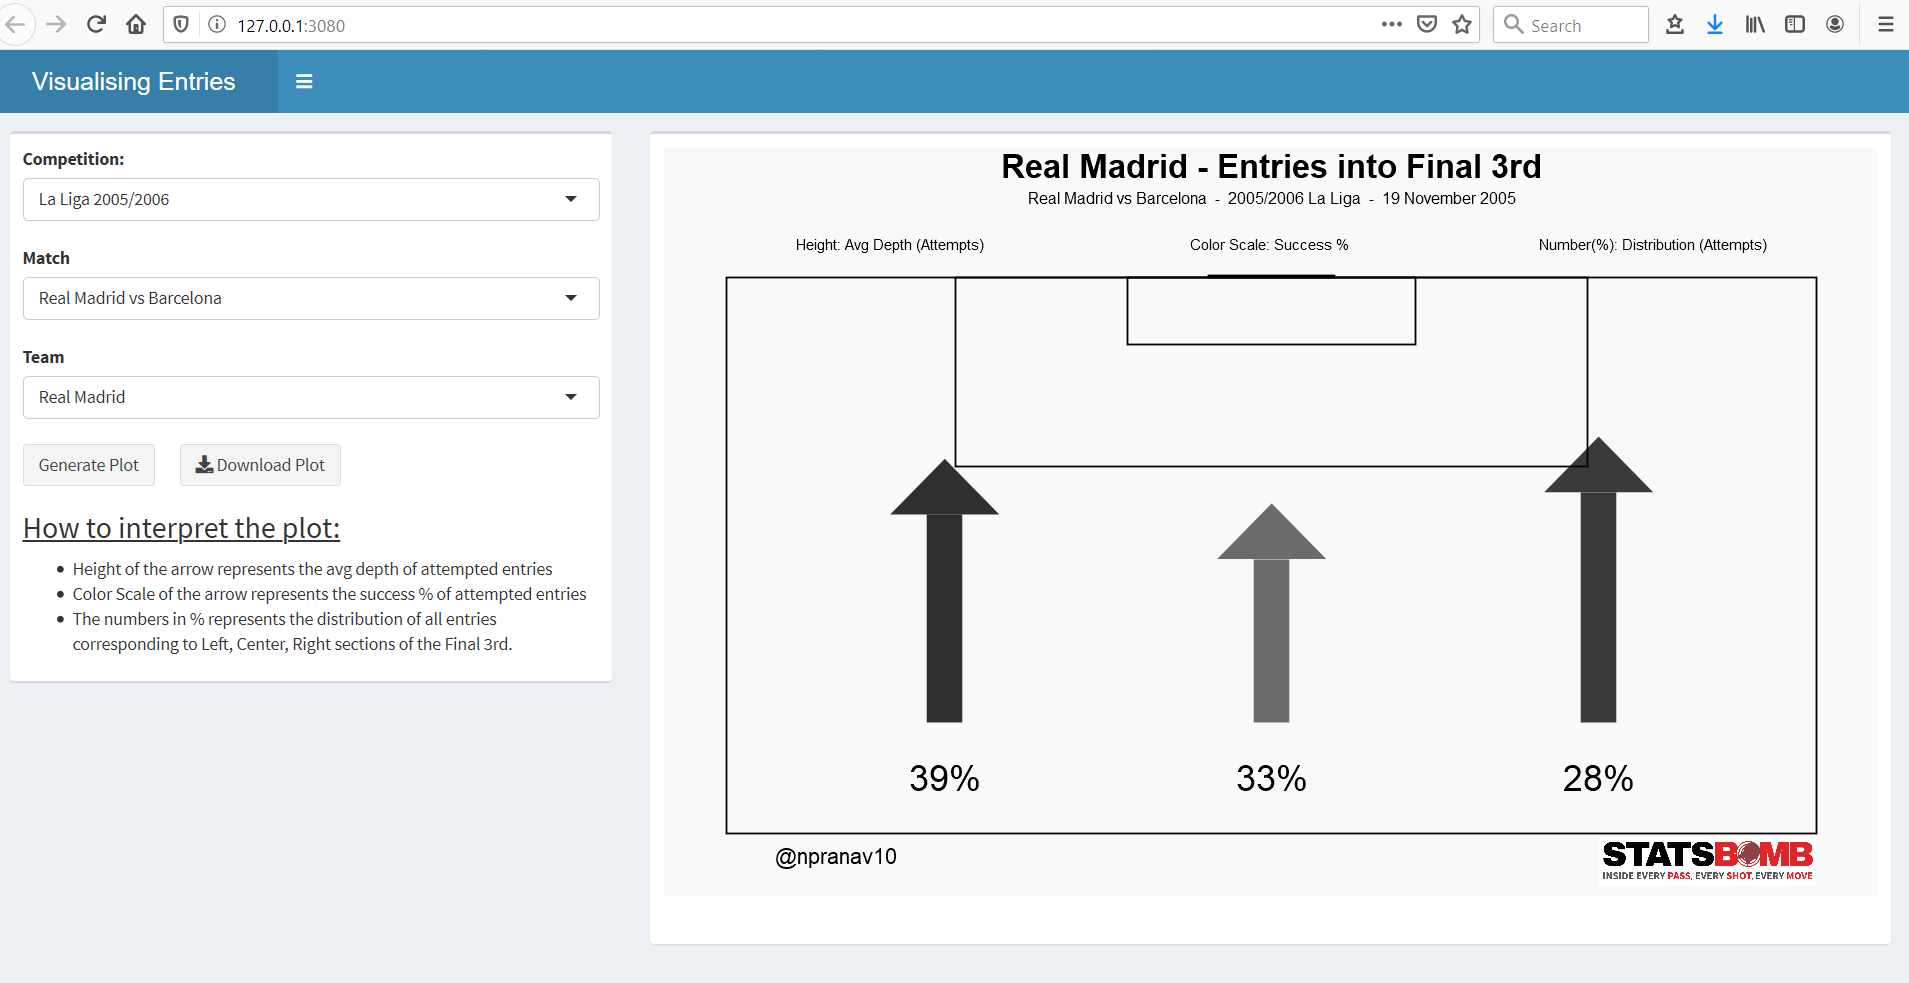
I have also built a Shiny Application using which you can get to see the entries graph for all teams from StatsBomb's publicly available 799 matches. (P.S: The app runs out of memory in shinyapps.io and I ran out of free-tier in AWS. So I am working hard to bring it live to you.)
library(shiny)
# Use runGitHub to soft download the app and run it in your local computer.
shiny::runGitHub("entries-into-final-third", "npranav10")
Code:
			Please  register yourself and agree to the terms
			before using StatsBomb data.
Code to plot flank attacks viz using StatsBomb data is available this GitHub repository. We'll load the helpers from the above repository into our R file using
source(). The following snippet
will give you a glimpse on how to proceed further.
library(dplyr)
# Loading the R functions to help us plot the data.
source("https://raw.githubusercontent.com/npranav10/entries-into-final-third/master/code-for-viz.R")
# Fetching free competitions from StatsBomb's GitHub repo.
Comps <- StatsBombR::FreeCompetitions()
Matches <- Comps %>%
filter(competition_id==43) %>%
StatsBombR::FreeMatches()
##################################################################################################
# Plotting viz for a Specific Team
##################################################################################################
# Filtering Portugal vs Iran match
Matches1 <- Matches %>%
filter(home_team.home_team_name == "Portugal" | away_team.away_team_name == "Portugal" ) %>%
filter(match_id==7557)
StatsBombData <- StatsBombFreeEvents(MatchesDF = Matches1, Parallel = T)
statsbomb_flank_attack(StatsBombData,"Portugal","Portugal vs Iran - 2018 FIFA World Cup")
##################################################################################################
# Plotting viz for a Specific Player
##################################################################################################
# Filtering out France matches to visualise Le Petit Prince's stats (Griezmann)
Matches2 <- Matches %>%
filter(home_team.home_team_name == "France" | away_team.away_team_name == "France" )
StatsBombData <- StatsBombFreeEvents(MatchesDF = Matches2, Parallel = T)
statsbomb_flank_attack_player(StatsBombData,"Antoine Griezmann","France - All Matches - 2018 FIFA World Cup")
This function plots the data and also returns a dataframe. Let's examine what's in it.
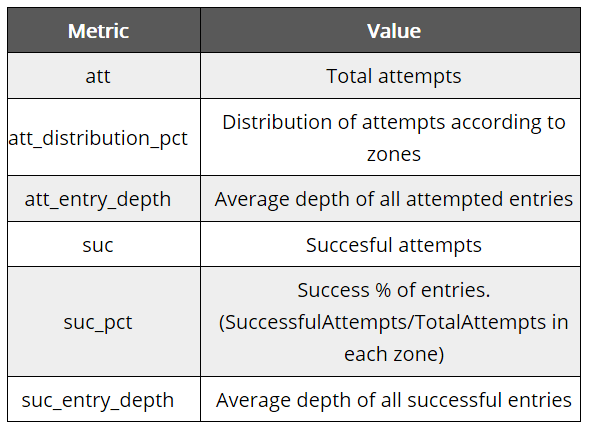
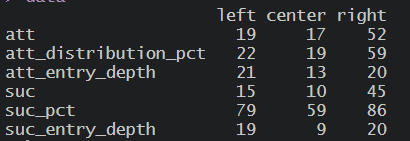
This dataframe corresponds to the Belgium's entries-into-final-third vs France.
Post-Match Conference:
Also a shout-out to Mark Thompson for giving me a thumbsup to proceed with this concept which his team at Twenty3 sport initally tested on.
